Working With Performance Monitor on Your Windows 7 Machine
Computers normally slow down for certain reasons. Some of these reasons are easily identified as useless software running in the background, unused programs taking up too much system resource, viruses and malware and as well as other hardware related errors like outdated drivers or a hard disk that has already went past the limits of its storage capacity. An old computer having a lot of files and installed programs on it also slows down significantly which is one sign that it already needs to undergo software reinstallation. But what if you have a new computer and you noticed that it went slow suddenly? What are you going to do? You already uninstalled programs and apps from it but still it is slow. You also disabled background processes but your machine still refuses to run smoothly. How are you going to identify the real cause of this?
Thankfully, Windows has a very efficient tool that will help you monitor your computer’s performance and pinpoint which programs, processes and aspects of your system causes this slowdown. This tool is called Performance Monitor or also known as PerfMon.exe on Windows 8. With this tool, you can see what programs best fits your CPU capacity. For instance, if you are fond of listening to music while doing some tasks on your machine using Microsoft Office applications then you can check which media player best performs with the open apps without taking or eating up too much system resource. With the details that this tool provides, you can easily think and search for alternatives that would somehow substitute programs that are not handled smoothly by your computer.
But before going to the details, I’ll first show you how to access this tool on your Windows 7 computer. Take note that this tool is also available on Windows Vista and Windows 8 but on Windows 8, it is best launched typing the “PerfMon.exe” on the Start Screen search box.
Accessing the Performance Monitor Tool
You can use different ways of accessing this tool on your Windows 7 machine but for this tutorial, I will be showing you two ways. The first one is probably the most preferred way of accessing any Windows system utilities. Read on to learn how to do this.
Accessing Performance Monitor from the Control Panel
This is the traditional way of accessing the tool and is mostly used by novice users. To do it, you first need to click on the “Start” button or the “Windows Orb” which can be found at the bottom-left corner of your computer screen (extreme-left end of the task bar).

Next, on the Start Menu, click on the “Control Panel” link located at the right side.

On the main “Control Panel” Window, click on “System and Security” then on the Window that follows, click “Administrative Tools”.

Once the Administrative Tools Window opens, look for the “Performance Monitor” shortcut from the list then just click on it to launch the tool.

Accessing the Tool Using the Start Menu Search Box
Another way of accessing the Performance Monitor Tool which also one of the easiest is by using the search feature on the Start Menu. To do this, just follow the steps below.
First, you would need to click on the “Start” button to open the Start Menu then type the words “performance monitor” on the search box as shown on the screenshot below.

After typing the words, just wait until the search results displays on top of the search box. The shortcut that leads to the “Performance Monitor” tool should be listed first under the “Programs” search results category as shown below.

After clicking on it, the Performance Monitor Window will open and it should look like the screenshot below.

Checking Your System Performance
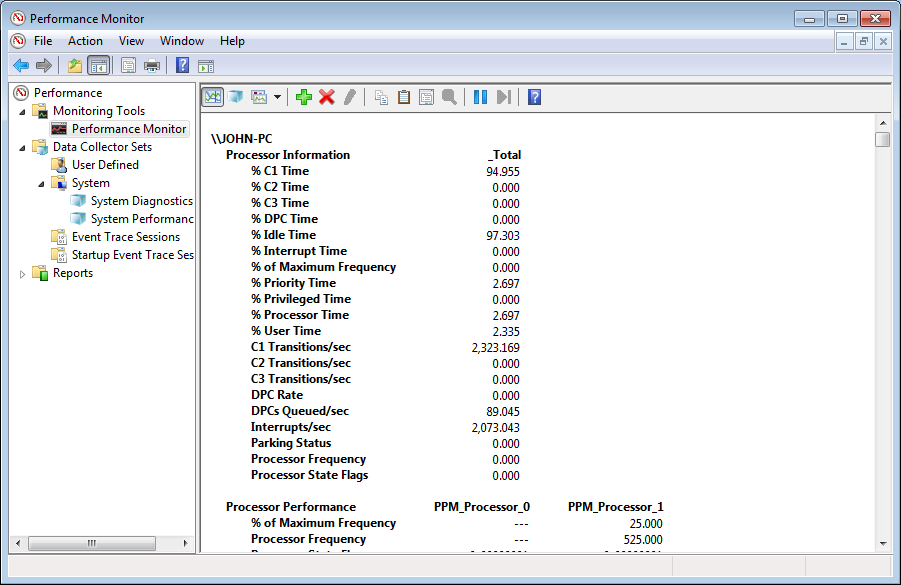
As I pointed out earlier, the tool is capable of monitoring performance and CPU Time of certain programs and processes running on your machine. In order to find out how your system components and processes are using your computer’s system resource and CPU. To do this, you need to click on the “Monitoring Tools” folder and after doing so, it will reveal the “Performance Monitor” tool contained in it. When you click on it, the performance graph will then show on the main panel as shown below.

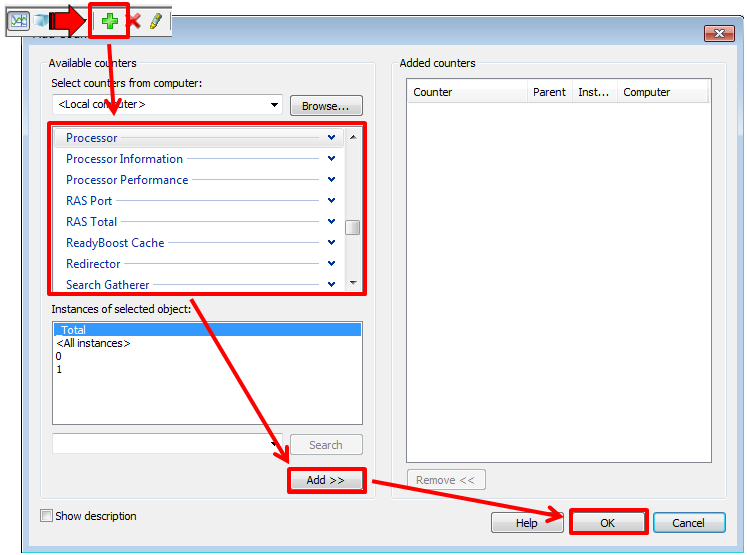
If you want to add more counters and graphs, you simply need to click on the green (+) icon located at the top of the graph. After doing so, you’ll see a pop up Window which contains a set of items which you can add to the graph for monitoring. To do this, you just need to select the counter which you want to add from the box located at the left of the pop-up Window then click on the “Add>>” button and afterwards, click on the “OK” button located at the bottom. Just refer to the screenshot below for a clearer illustration of the process.
If you want to remove counters from the graph, all you need to do is select the item which you want to remove from the box that is located below the graph then click on the (x) icon colored red which is located at the right of the green (+) icon on top of the graph as shown on the screenshot that follows.

You can also change the view of the graphs by clicking on the icon that is on the left side of the green (+) icon. After clicking on it, a drop-down options will open which contains the the graph types (Line, History bar, Report). The graph shown on the screenshot above shows the “Line” graph view. The screenshot below shows the two other types “History bar” and “Report” with counters that show the Processor Performance and Processor Information.

Adding a lot of counters on the graph will make it look cluttered especially when you are on the “Line” graph view. If you chose the “History bar” view, the bars will appear smaller making it hard to identify the counter which you really want to view and monitor performance for. The screenshot above shows the graph set in the “History bar” view. The screenshot below shows the graph in “Report” view.
What to Do When Things Does Not Make Sense
Most of the counters on the Performance Monitor tool are highly technical having names which are quite hard to identify and link with its functions. If you want to find more information about a specific counter, it would be helpful if you first do a web search on what it does and to what program or process it is linked to so you can effectively monitor the aspects which you want to watch. Effective monitoring of some processes may also require you to observe a counter for 2-3 minutes so you can identify how it uses CPU Time and system resource (RAM).
As you can see, the Performance Monitor Tool on Windows 7 is a rich source of information regarding your computer’s components and programs but what we discussed on this tutorial were only the basics. Watch out for future articles covering this same tool which will explain deeply on other things which you can do with it. If you have other questions and concerns regarding the Performance Monitor Tool please feel free to post them as comments below.